Tutorial 6: Special Plotting Functions
Goal
Use high-value EasyPlot plotting utilities beyond raw MATLAB defaults:
EasyPlot.plotShadedEasyPlot.scalebarEasyPlot.violinplot
(also explore EasyPlot.boundedLine, EasyPlot.significanceLine, EasyPlot.venn)
Example
rng(6);
fig = EasyPlot.figure('Visible', 'off');
ax = EasyPlot.createGridAxes(fig, 1, 3, ...
'Width', 3.0, 'Height', 2.6, ...
'MarginBottom', 0.9, ...
'FontSize', 7);
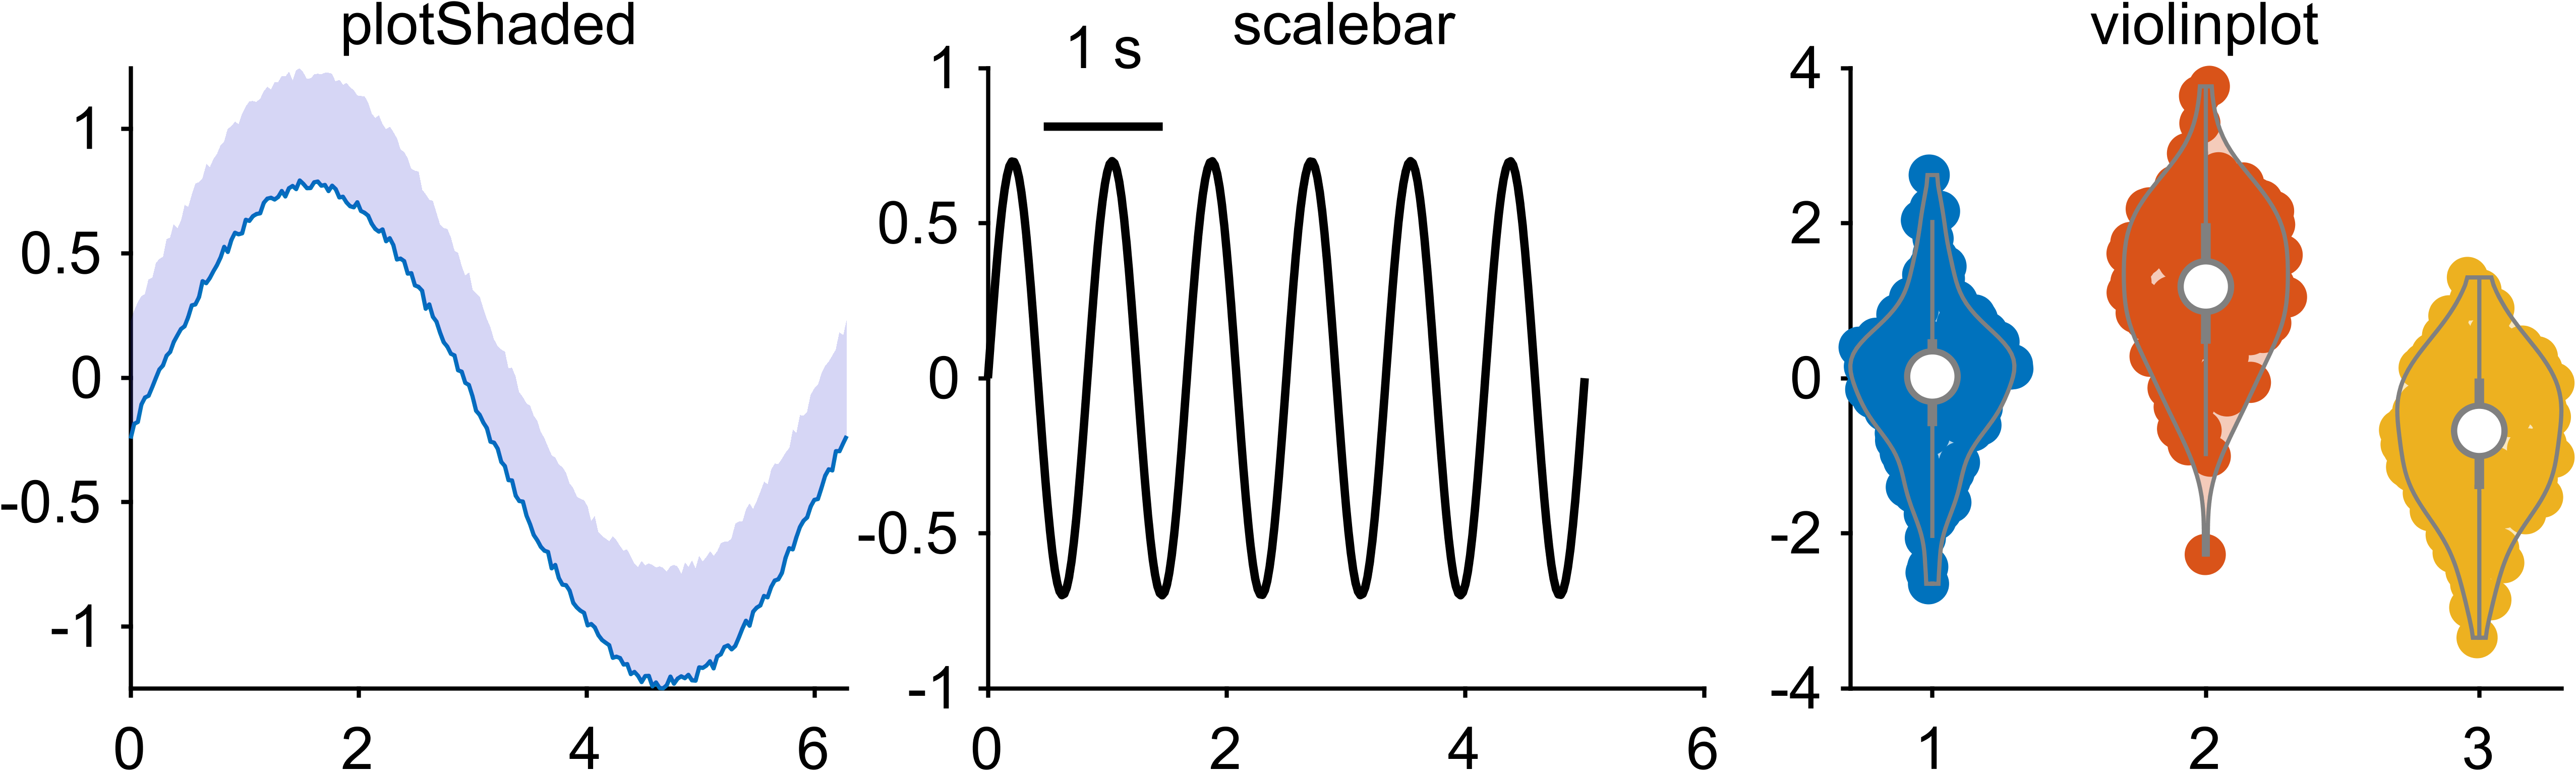
% (1) plotShaded
x = linspace(0, 2*pi, 200);
y = sin(x);
y_low = y - 0.2 - 0.05*rand(size(y));
y_high = y + 0.2 + 0.05*rand(size(y));
EasyPlot.plotShaded(ax{1}, x, [y_low; y_high], ...
'shadedColor', [0.2,0.2,0.8], 'alpha', 0.2, 'drawLine', 'on');
title(ax{1}, 'plotShaded', 'FontSize', 7);
% (2) scalebar
t = 0:0.02:5;
s = 0.7*sin(2*pi*1.2*t);
plot(ax{2}, t, s, 'k-', 'LineWidth', 1.0);
h_sb = EasyPlot.scalebar(ax{2}, 'X', ...
'location', 'northwest', ...
'xBarLabel', '1 s', ...
'xBarLength', 1, ...
'xBarRatio', 1, ...
'fontSize', 7);
EasyPlot.move(h_sb, 'dx', 0.08, 'dy', -0.10);
title(ax{2}, 'scalebar', 'FontSize', 7);
% (3) violinplot
d = [randn(120,1); randn(120,1)+1.2; randn(120,1)-0.8];
g = [ones(120,1); 2*ones(120,1); 3*ones(120,1)];
EasyPlot.violinplot(ax{3}, d, g);
title(ax{3}, 'violinplot', 'FontSize', 7);
EasyPlot.cropFigure(fig);
EasyPlot.exportFigure(fig, fullfile('./docs/tutorials/_images', 'tutorial6_special_functions.png'));
Expected output
More special methods
EasyPlot.boundedLinefor mean +/- error ribbons.EasyPlot.significanceLinefor compact significance annotations.EasyPlot.vennfor 2-set/3-set overlap visualization.
Completion
You now have the recommended EasyPlot learning path from foundation to advanced plotting.