Tutorial 3: Multi-Axes Wrappers for Labels, Ticks, and Titles
Goal
Use EasyPlot wrappers that extend MATLAB-style axis functions to multiple axes (including 2D cell arrays) at once.
Core functions
EasyPlot.setXLabelRow/EasyPlot.setYLabelColumnEasyPlot.setXTicksAndLabels/EasyPlot.setYTicksAndLabels
Example
fig = EasyPlot.figure('Visible', 'off');
ax_all = EasyPlot.createGridAxes(fig, 2, 2, ...
'Width', 3.0, 'Height', 2.5, ...
'MarginBottom', 0.9, 'MarginLeft', 0.8, ...
'FontSize', 7);
x = linspace(0, 1, 120);
for k = 1:numel(ax_all)
ax = ax_all{k};
plot(ax, x, randn(1, numel(x))*0.08 + 0.5*sin(2*pi*x + k), ...
'LineWidth', 0.9);
end
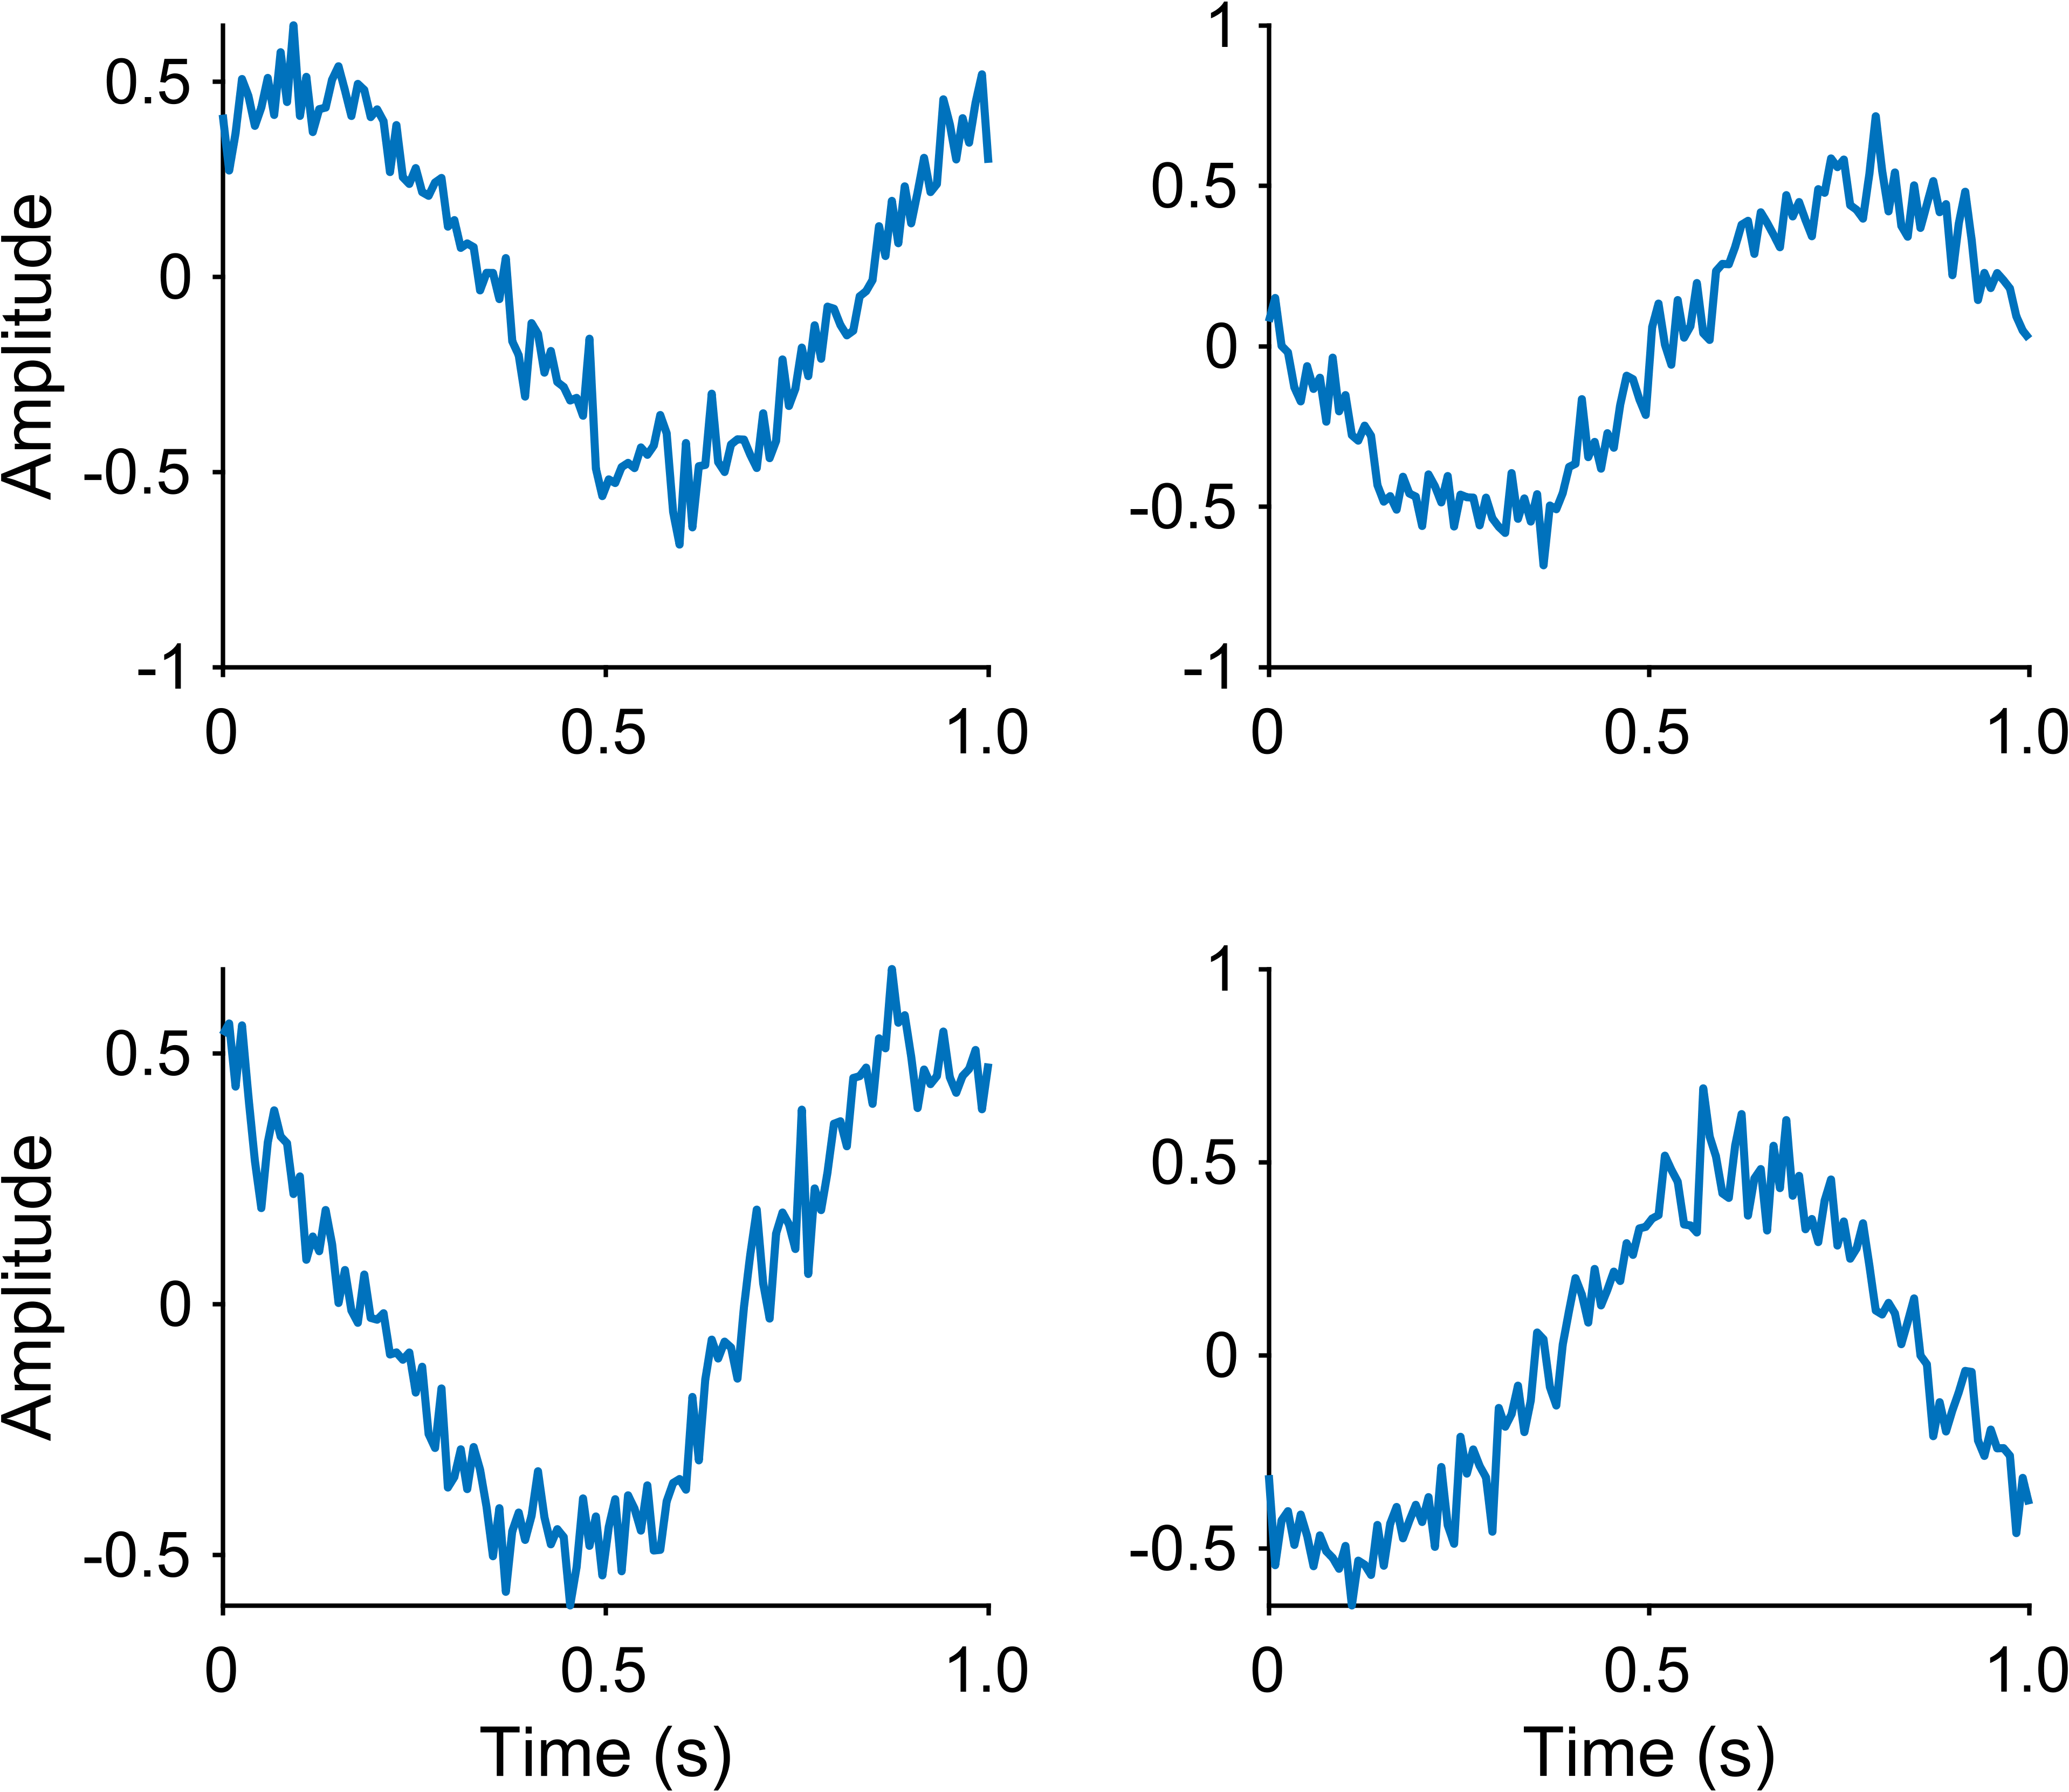
EasyPlot.setXLabelRow(ax_all(2,:), 'Time (s)');
EasyPlot.setYLabelColumn(ax_all(:,1), 'Amplitude');
xt = [0, 0.5, 1.0];
EasyPlot.setXTicksAndLabels(ax_all, xt, {'0', '0.5', '1.0'});
EasyPlot.cropFigure(fig);
EasyPlot.exportFigure(fig, fullfile('./docs/tutorials/_images', 'tutorial3_multi_axes_wrappers.png'));
Expected output
Notes
These wrappers reduce repetitive code in large multi-panel figures.
You can still mix in raw MATLAB calls when needed.
Next step
Continue with Tutorial 4: Shared Limits (xlim/ylim/clim).