Tutorial 2: Multi-Panel Layout Principles
Goal
Understand layout principles and panel composition with EasyPlot:
margins and relative positioning,
createGridAxesandcreateAxesAgainstAxes,storing panels in 2D cell arrays,
place/align/move.
Core functions
EasyPlot.createGridAxesEasyPlot.createAxesAgainstAxesEasyPlot.placeEasyPlot.alignEasyPlot.move
Layout model
The figure below is useful for understanding how EasyPlot thinks about layout.
The axes have their own Width and Height, but they also reserve
MarginLeft, MarginRight, MarginTop, and MarginBottom. The figure
itself has another set of margins. After EasyPlot.cropFigure(fig), the final
canvas size is determined by the axes sizes plus all reserved margins.
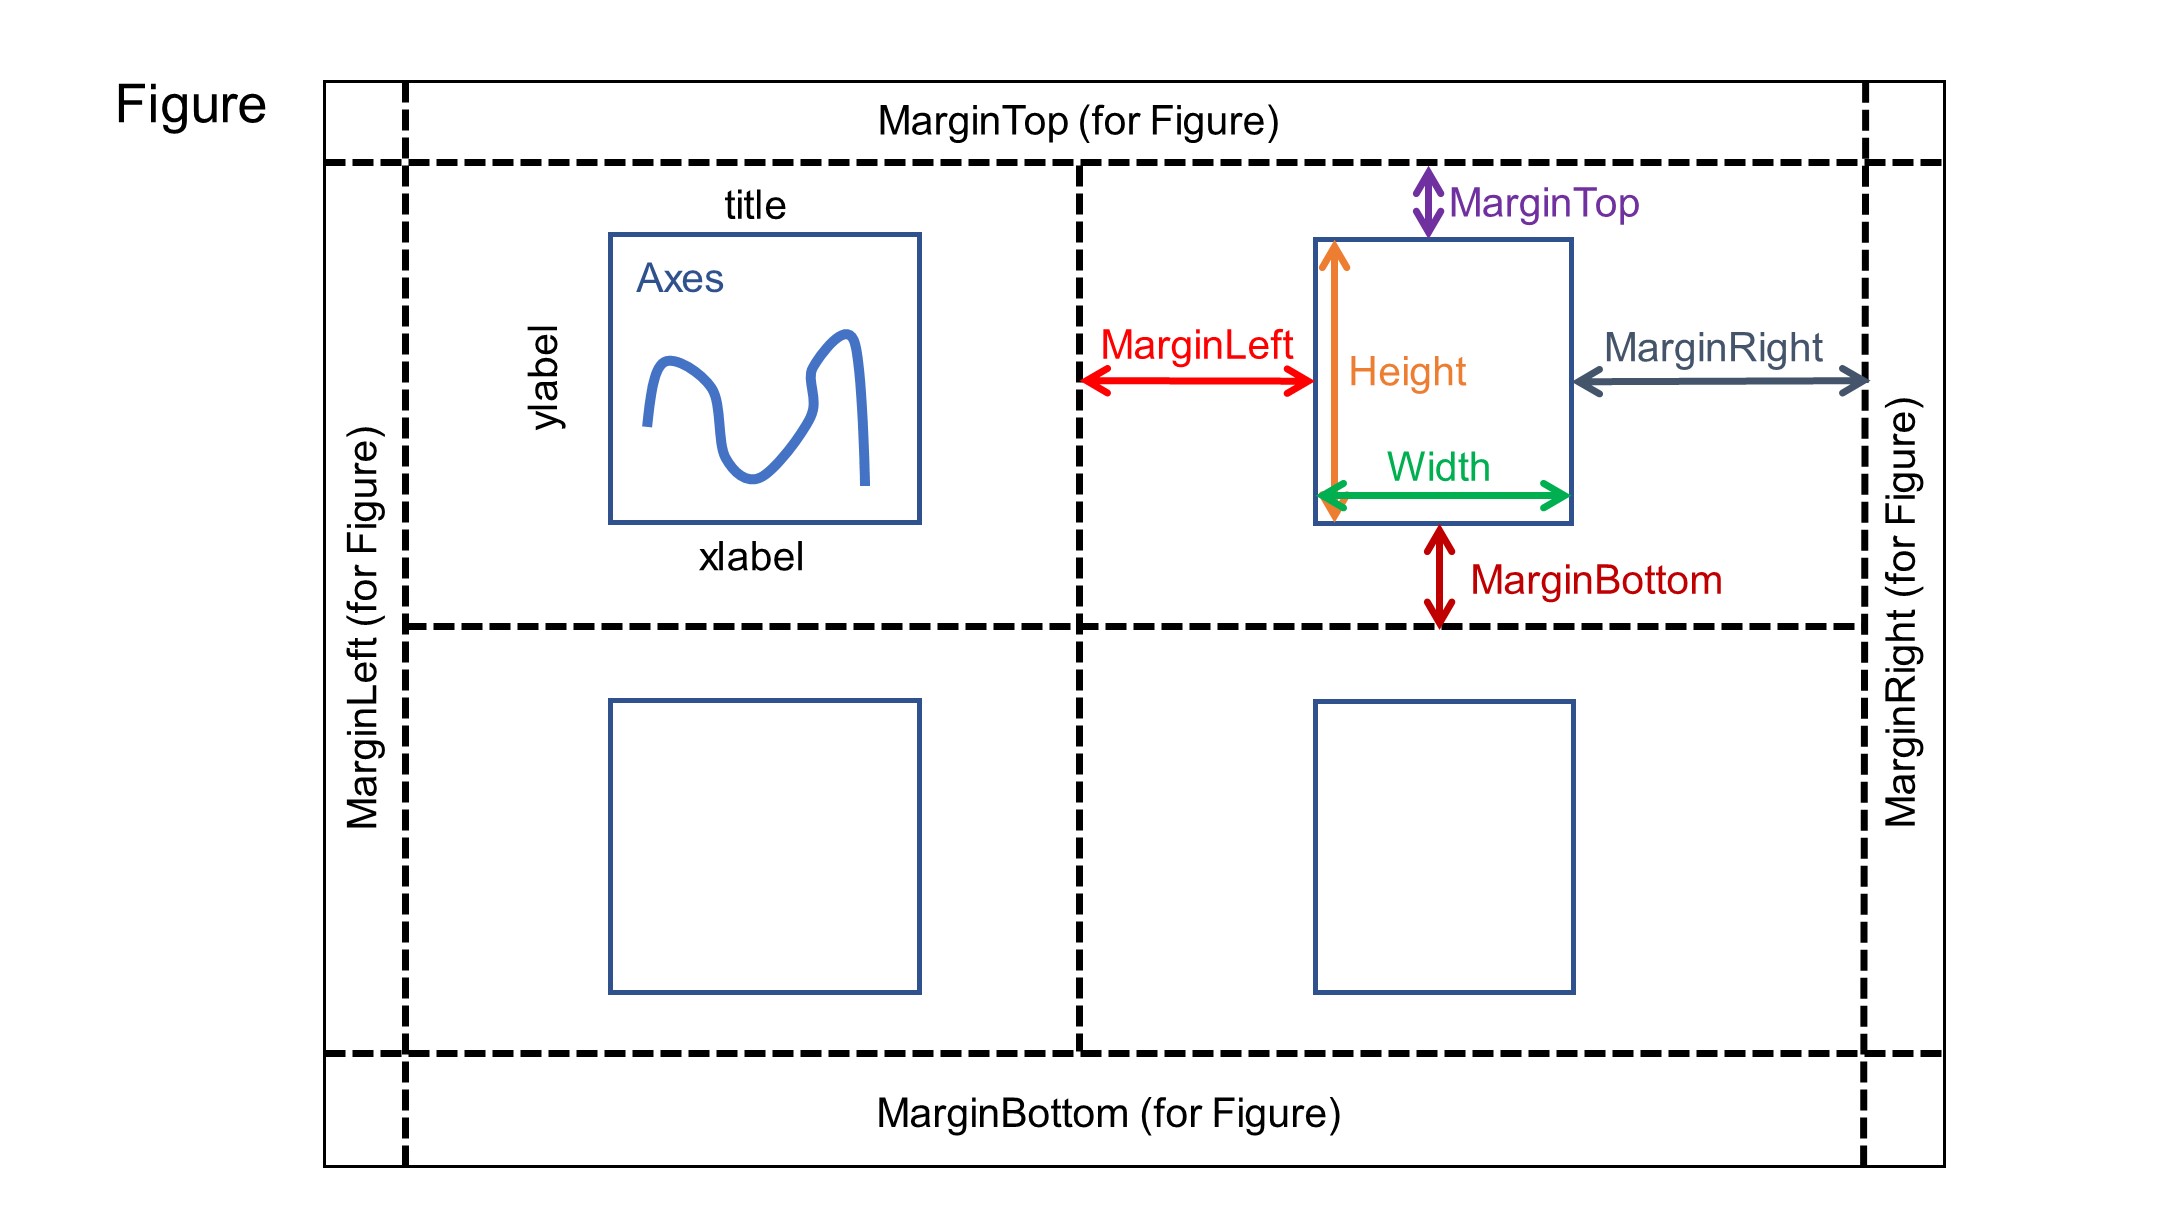
Read this diagram as:
axes
WidthandHeightdefine the plotting area itself,axes margins define the extra space that belongs to labels, ticks, and titles,
figure margins define the outer whitespace of the entire composition,
cropping at the end converts those layout decisions into the final figure size.
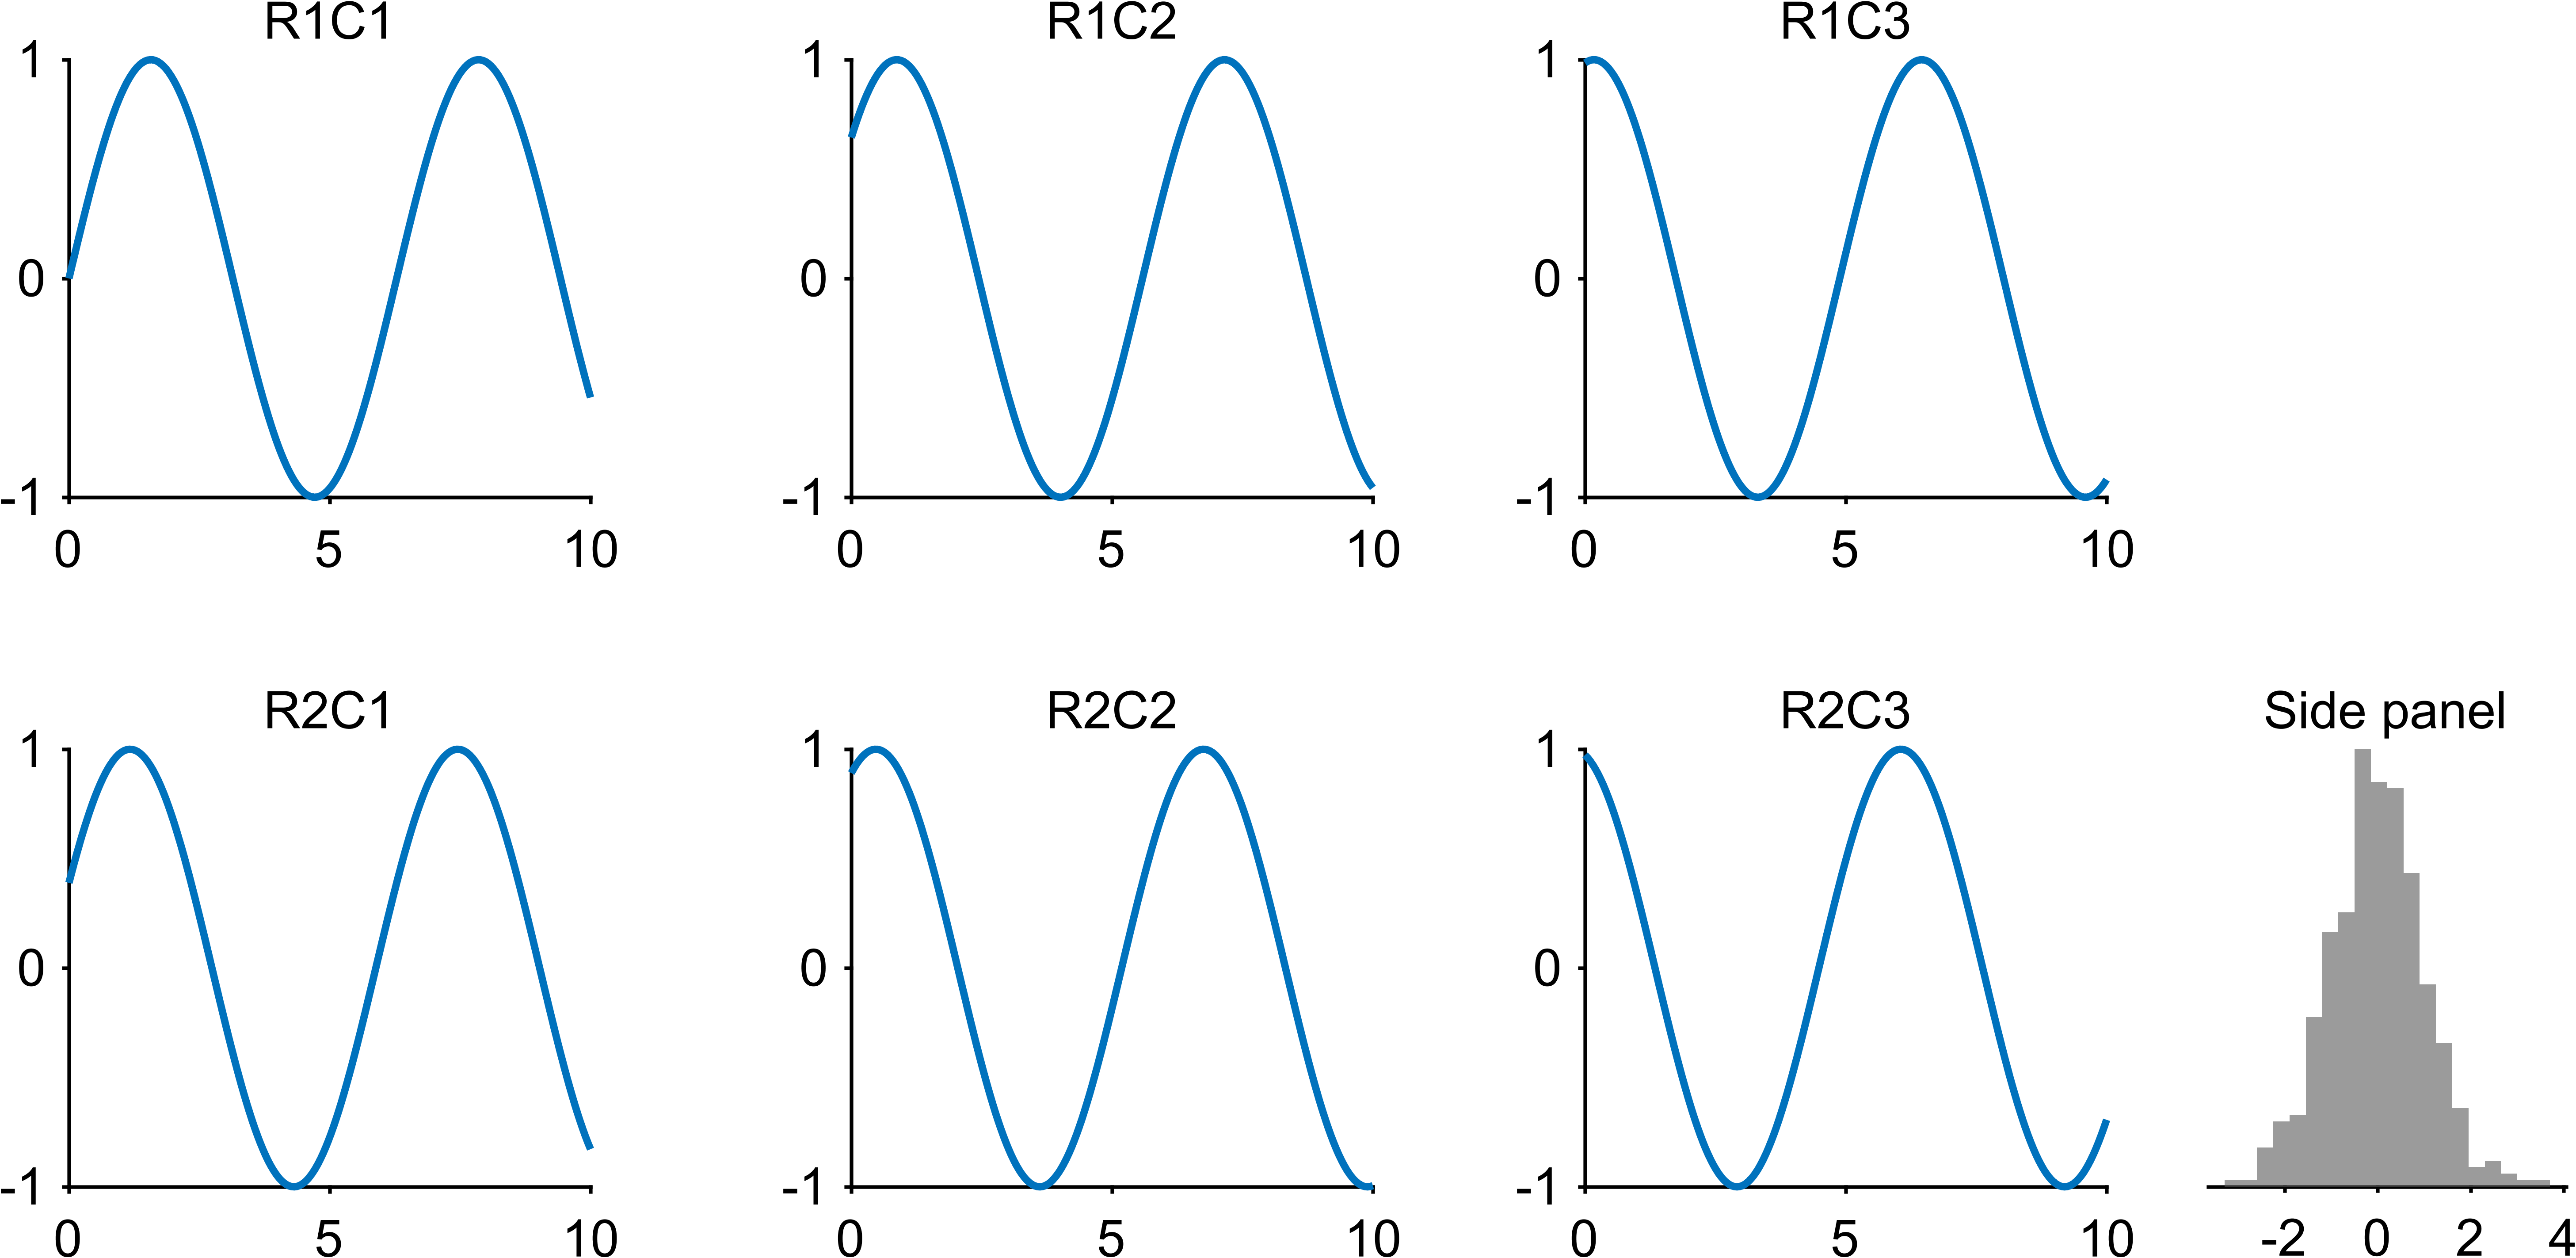
Example
fig = EasyPlot.figure('Visible', 'off');

ax_grid = EasyPlot.createGridAxes(fig, 2, 3, ...
    'Width', 2.5, 'Height', 2.1, ...
    'MarginLeft', 0.55, 'MarginRight', 0.45, ...
    'MarginTop', 0.45, 'MarginBottom', 0.75, ...
    'FontSize', 7);

ax_side = EasyPlot.createAxesAgainstAxes(fig, ax_grid{1,3}, 'right', ...
    'Width', 1.7, 'Height', 2.1, 'YAxisVisible', 'off', 'FontSize', 7);

for r = 1:2
    for c = 1:3
        ax = ax_grid{r,c};
        x = linspace(0, 10, 200);
        plot(ax, x, sin(x + 0.4*(r-1) + 0.7*(c-1)), 'LineWidth', 1);
        title(ax, sprintf('R%dC%d', r, c), 'FontSize', 7);
    end
end

histogram(ax_side, randn(450,1), 20, ...
    'FaceColor', [0.35,0.35,0.35], 'EdgeColor', 'none');
title(ax_side, 'Side panel', 'FontSize', 7);

EasyPlot.align(ax_side, ax_grid{2,3}, 'bottom');
EasyPlot.place(ax_side, ax_grid{2,3}, 'right');
EasyPlot.move(ax_grid(:,2:3), 'dx', 0.25);

EasyPlot.cropFigure(fig);
EasyPlot.exportFigure(fig, fullfile('./docs/tutorials/_images', 'tutorial2_layout.png'));
Expected output
Layout tips
Think in relationships (right-of, bottom-of, aligned-to) instead of absolute coordinates.
Keep panels in cell arrays so batch operations stay simple and robust.
Use margins to reserve space for labels and titles before you start moving panels around.
Crop only at the end, after the layout is stable.
Next step
Continue with Tutorial 3: Multi-Axes Wrappers for Labels, Ticks, and Titles.