Tutorial 4: Shared Limits (xlim/ylim/clim)
Goal
Set limits consistently across panels, either with explicit ranges or by using
EasyPlot’s 'largest' mode.
Core functions
EasyPlot.setXLimEasyPlot.setYLimEasyPlot.setCLim
Example
fig = EasyPlot.figure('Visible', 'off');
ax_all = EasyPlot.createGridAxes(fig, 1, 3, ...
'Width', 3.0, 'Height', 2.8, ...
'MarginBottom', 0.9, 'FontSize', 7);
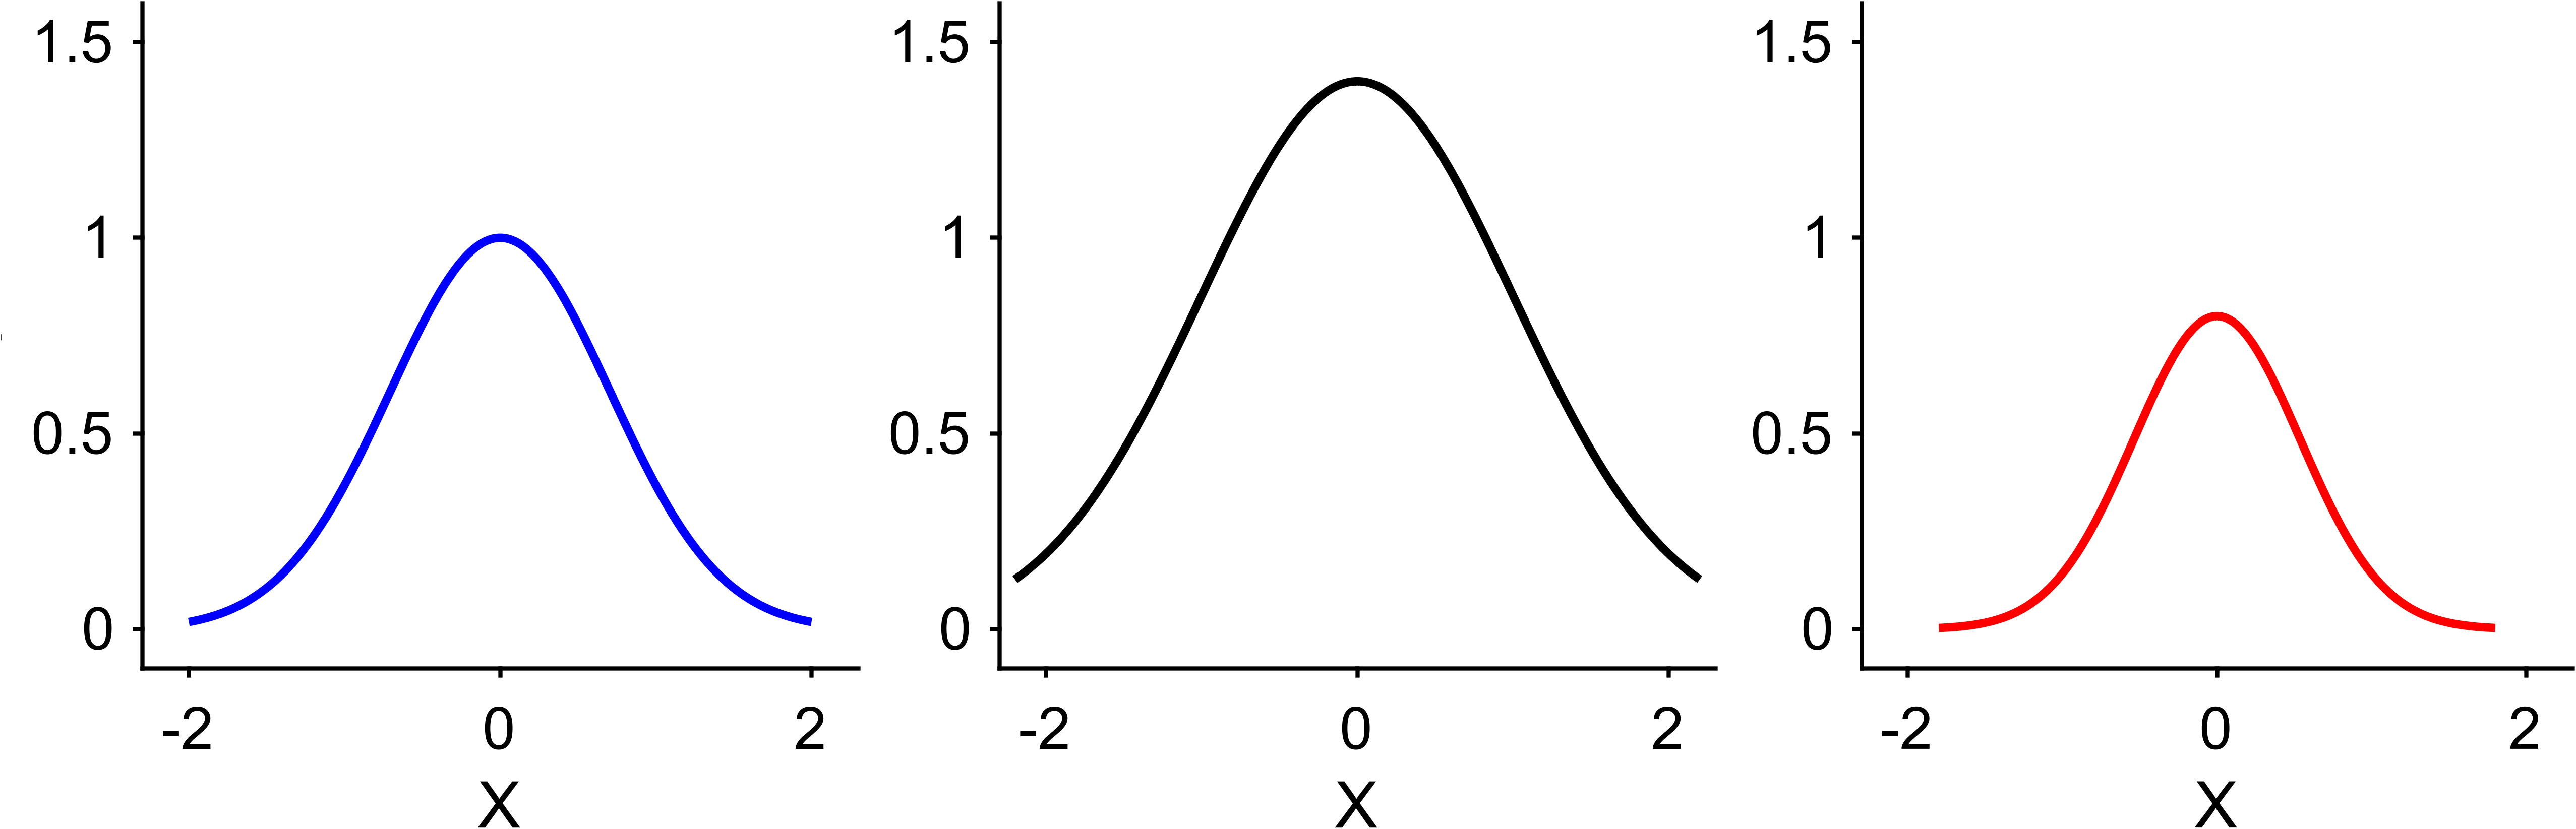
x = linspace(-2, 2, 200);
y1 = exp(-x.^2);
y2 = 1.4*exp(-0.6*x.^2);
y3 = 0.8*exp(-1.4*x.^2);
plot(ax_all{1}, x, y1, 'b-', 'LineWidth', 1);
plot(ax_all{2}, x*1.1, y2, 'k-', 'LineWidth', 1);
plot(ax_all{3}, x*0.9, y3, 'r-', 'LineWidth', 1);
EasyPlot.setXLim(ax_all, [-2.3, 2.3]);
EasyPlot.setYLim(ax_all, [-0.1, 1.6]);
EasyPlot.setXLabelRow(ax_all, 'X');
EasyPlot.setYLabelRow(ax_all, 'Y');
EasyPlot.cropFigure(fig);
EasyPlot.exportFigure(fig, fullfile('./docs/tutorials/_images', 'tutorial4_shared_limits.png'));
Expected output
Guidance
Use explicit limits when you need strict comparability.
Use
'largest'for quick harmonization across exploratory panels.
Next step
Continue with Tutorial 5: Heatmaps, CLim, Colormap, and Colorbar.