Tutorial 1: Figure, Axes, Set, Crop, Export
Goal
Learn the core EasyPlot workflow:
create a figure and axes,
set properties during creation or later with
EasyPlot.set,crop final canvas,
export publication-ready outputs.
Core functions
EasyPlot.figureEasyPlot.axesEasyPlot.setEasyPlot.cropFigureEasyPlot.exportFigure
Example
fig = EasyPlot.figure('Visible', 'off', 'MarginLeft', 0.5, 'MarginBottom', 0.5);
ax = EasyPlot.axes(fig, ...
'Width', 5.2, 'Height', 3.6, ...
'MarginLeft', 0.9, 'MarginBottom', 0.9, ...
'FontSize', 8, 'Box', 'on');
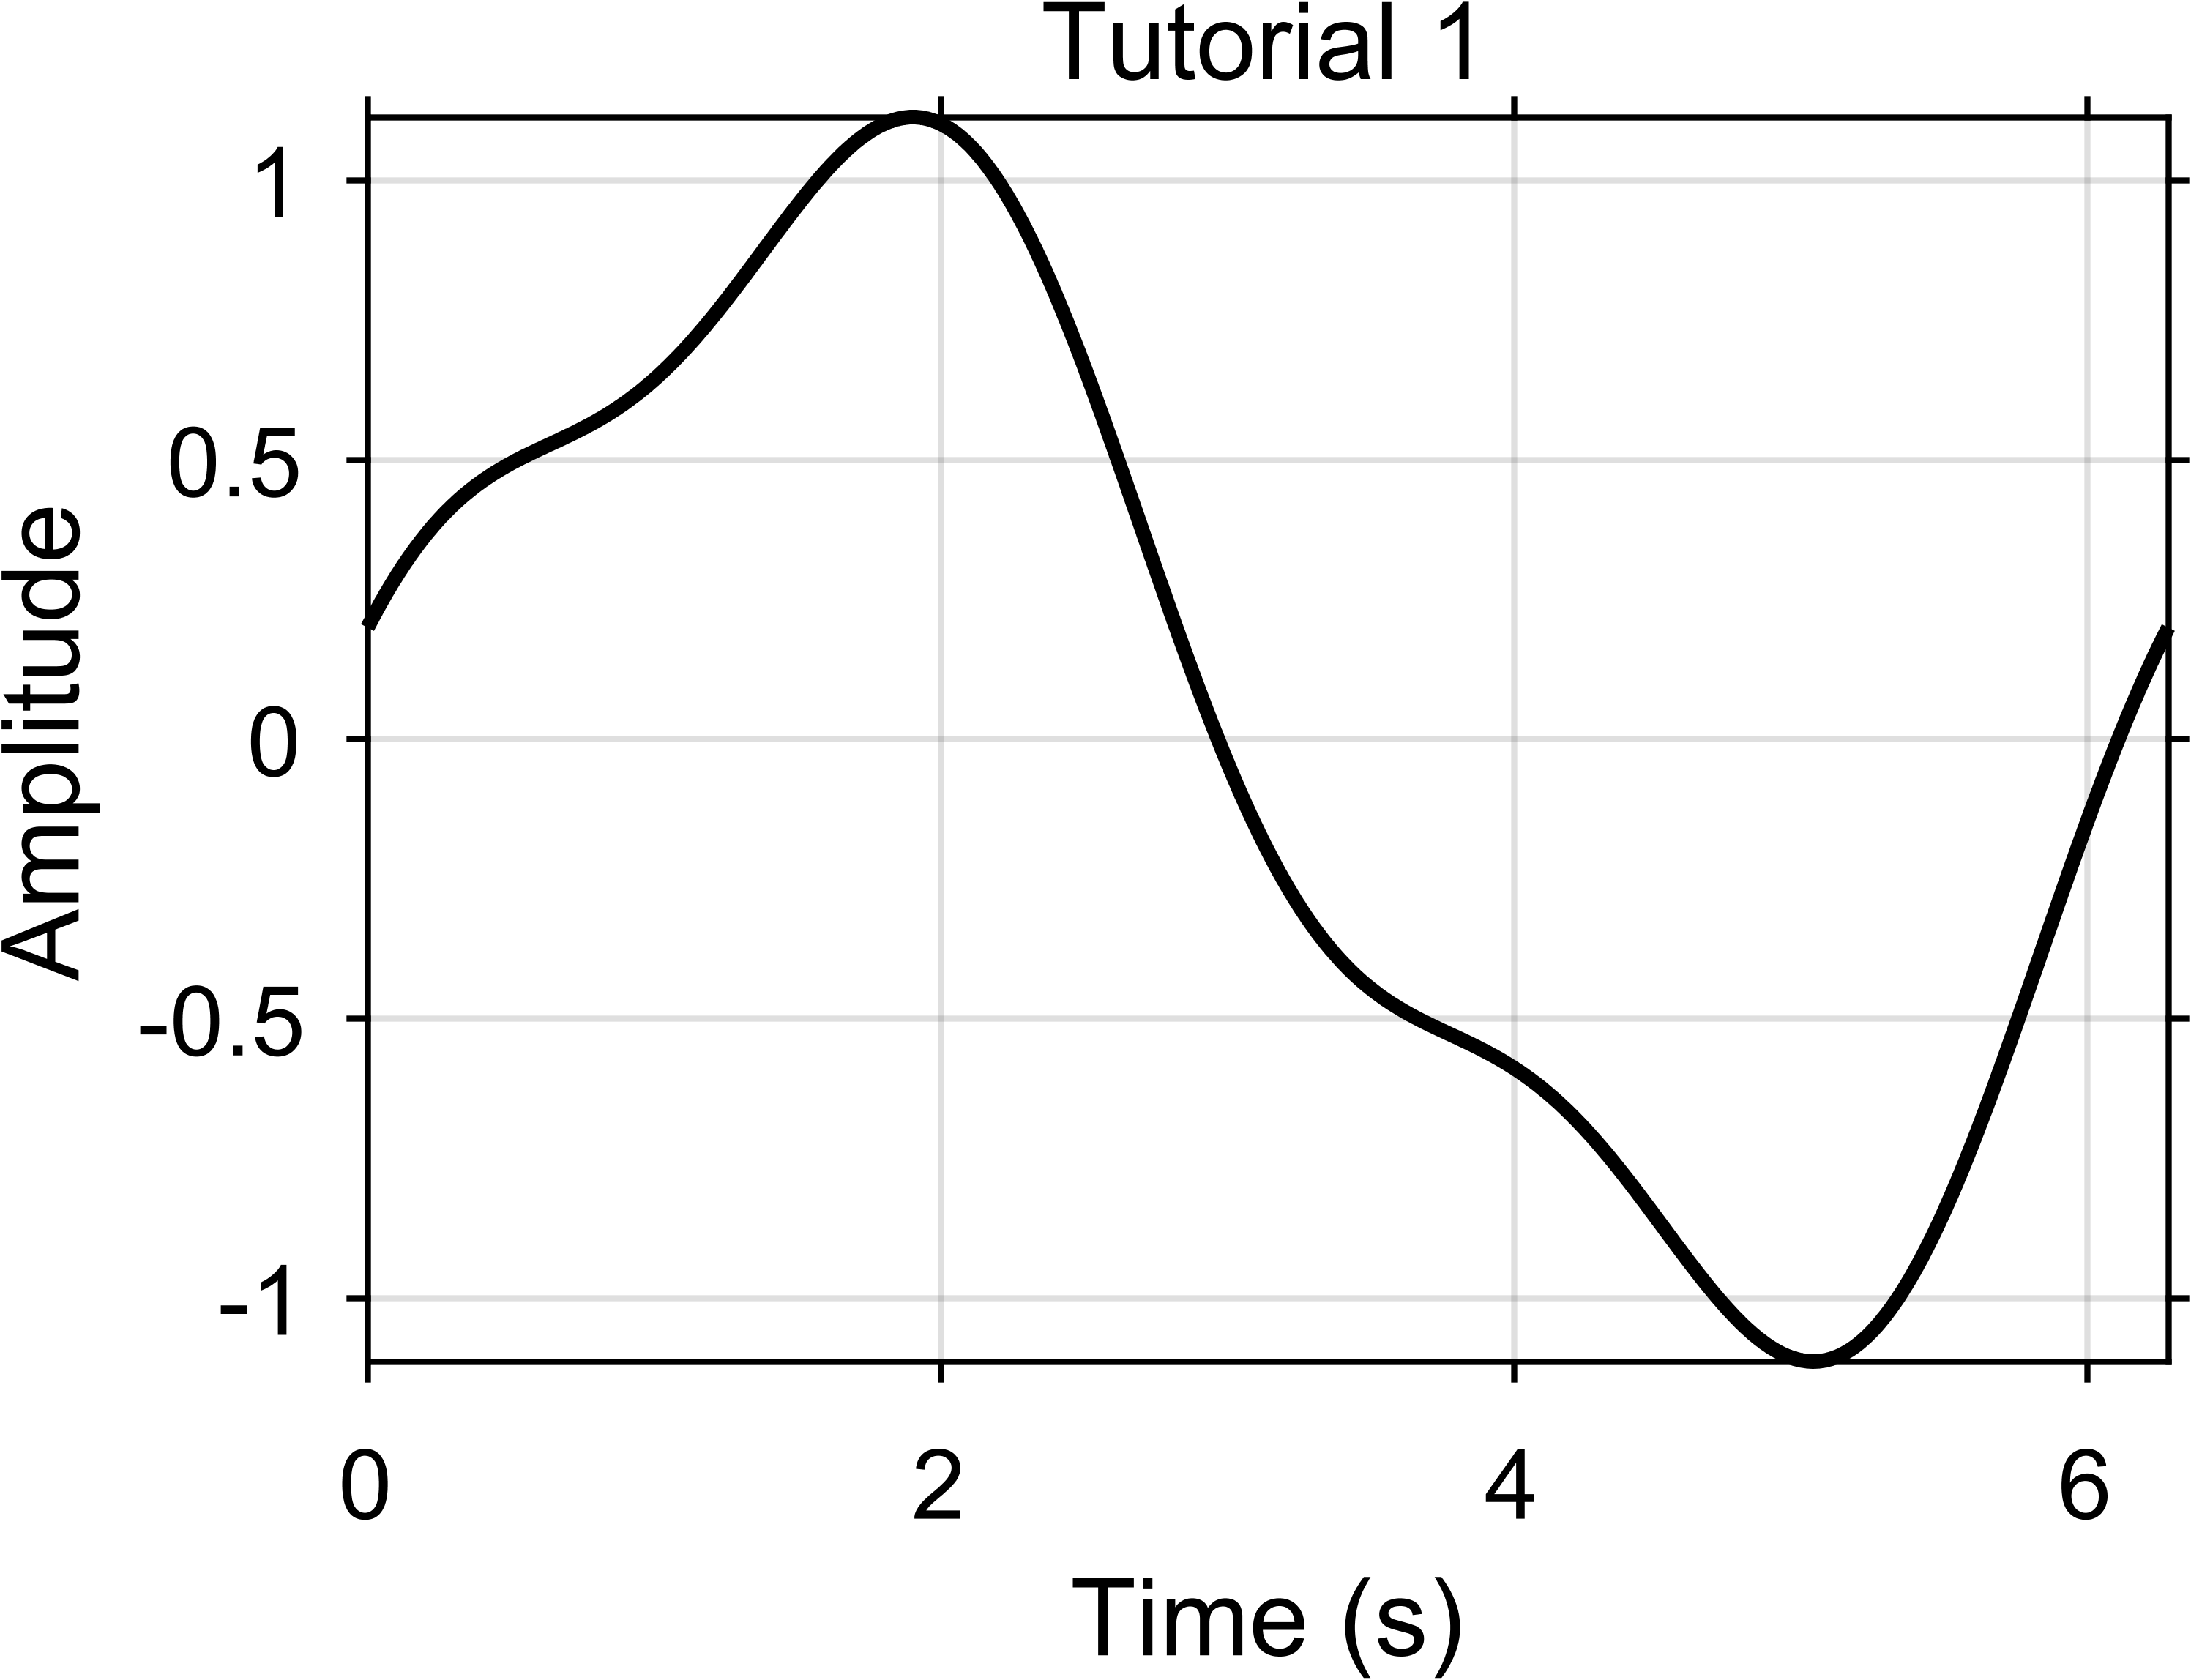
x = linspace(0, 2*pi, 300);
y = sin(x) + 0.2*cos(3*x);
plot(ax, x, y, 'k-', 'LineWidth', 1.2);
EasyPlot.set(ax, 'XGrid', 'on', 'YGrid', 'on');
xlabel(ax, 'Time (s)');
ylabel(ax, 'Amplitude');
title(ax, 'Tutorial 1');
EasyPlot.cropFigure(fig);
EasyPlot.exportFigure(fig, fullfile('./docs/tutorials/_images', 'tutorial1_basic.png'));
Expected output
Practical notes
Prefer EasyPlot constructors over raw MATLAB
figure/axesfor consistent defaults.The plotting command is still the normal MATLAB command; only the axis handle is made explicit.
Margins are part of the layout. They reserve room for labels and titles before you crop.
Call
EasyPlot.cropFigurenear the end, after layout and annotations are done.Export after the figure already looks correct on screen.
Next step
Continue with Tutorial 2: Multi-Panel Layout Principles.